Dashboard
1. Purpose and Significance
A Dashboard is a visual control panel that displays important information and key metrics regarding the cybersecurity posture, incident handling performance of the operations team, and trending of various alert types. This is achieved through various charts, tables, or other components. Ultimately, this feature helps users gain a comprehensive overview of activities and statistics relevant to their organization, enabling them to make quick and accurate decisions to improve any underperforming metrics within their organization. The Dashboard serves the following main purposes:
- Enhancing efficiency for direct operational staff
- Monitoring operational quality.
- Tracking the organization's cybersecurity posture.
2. Dashboard List
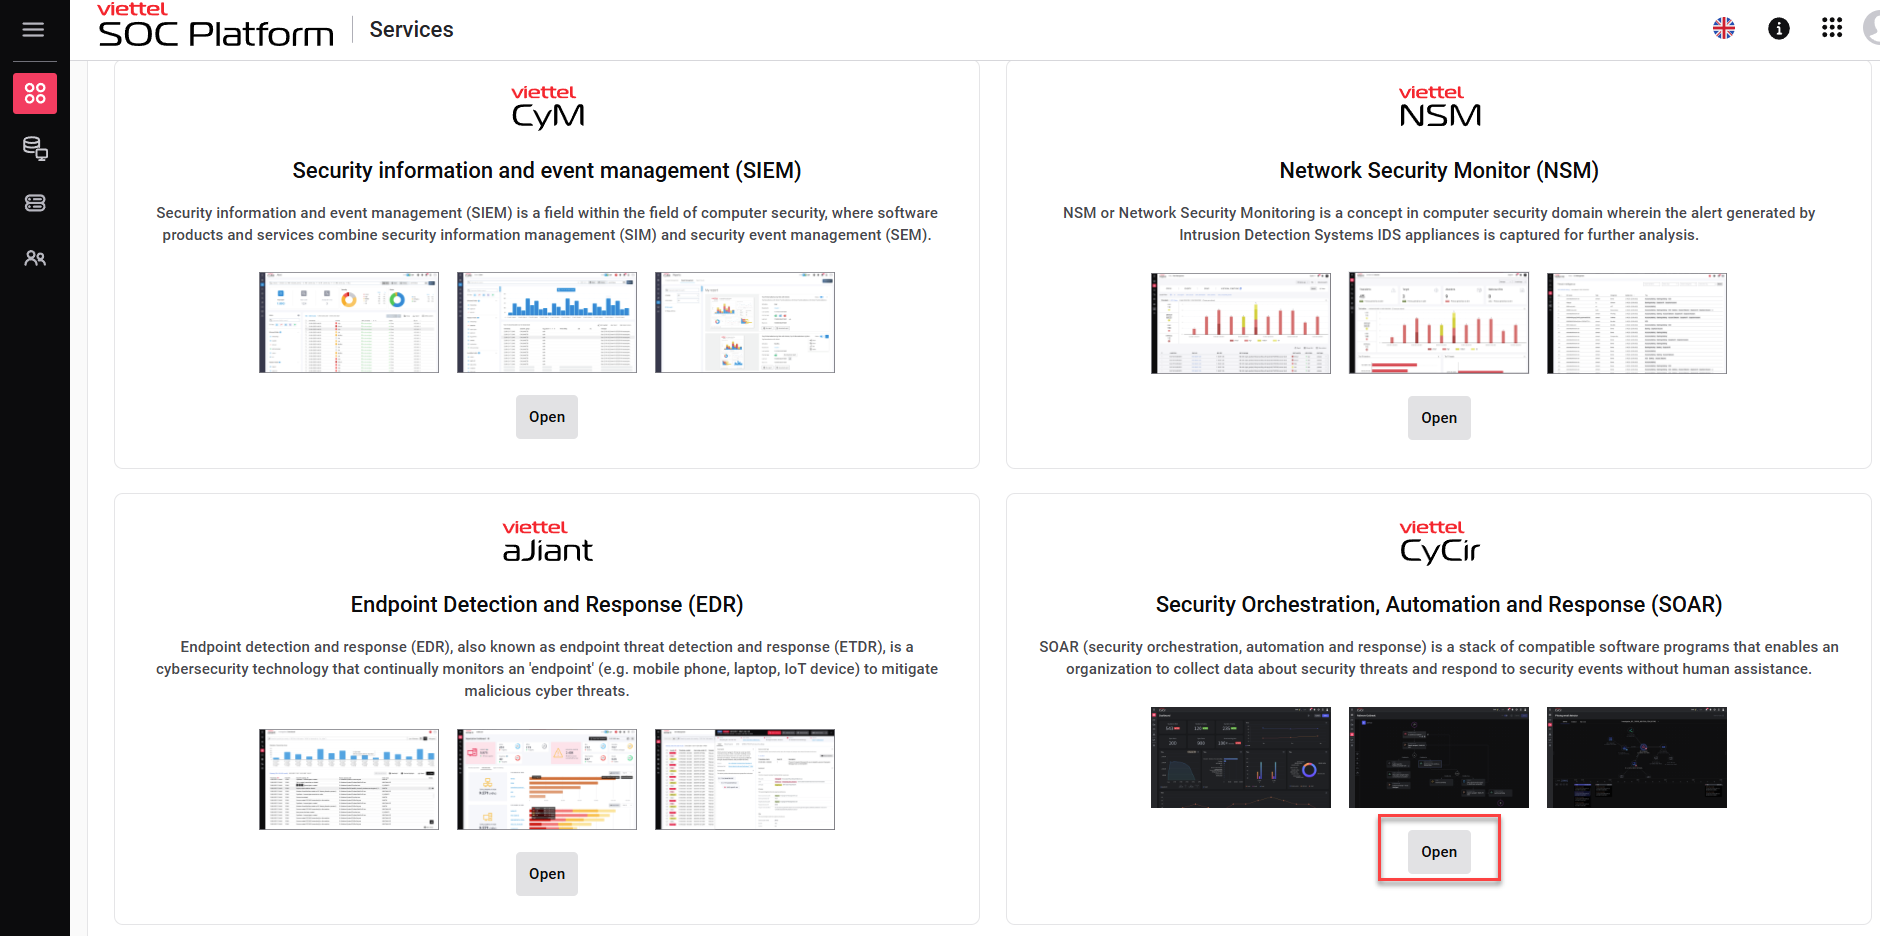
Precondition: The user is logged into the system.
- On the menu bar, select Services >> Click Open.
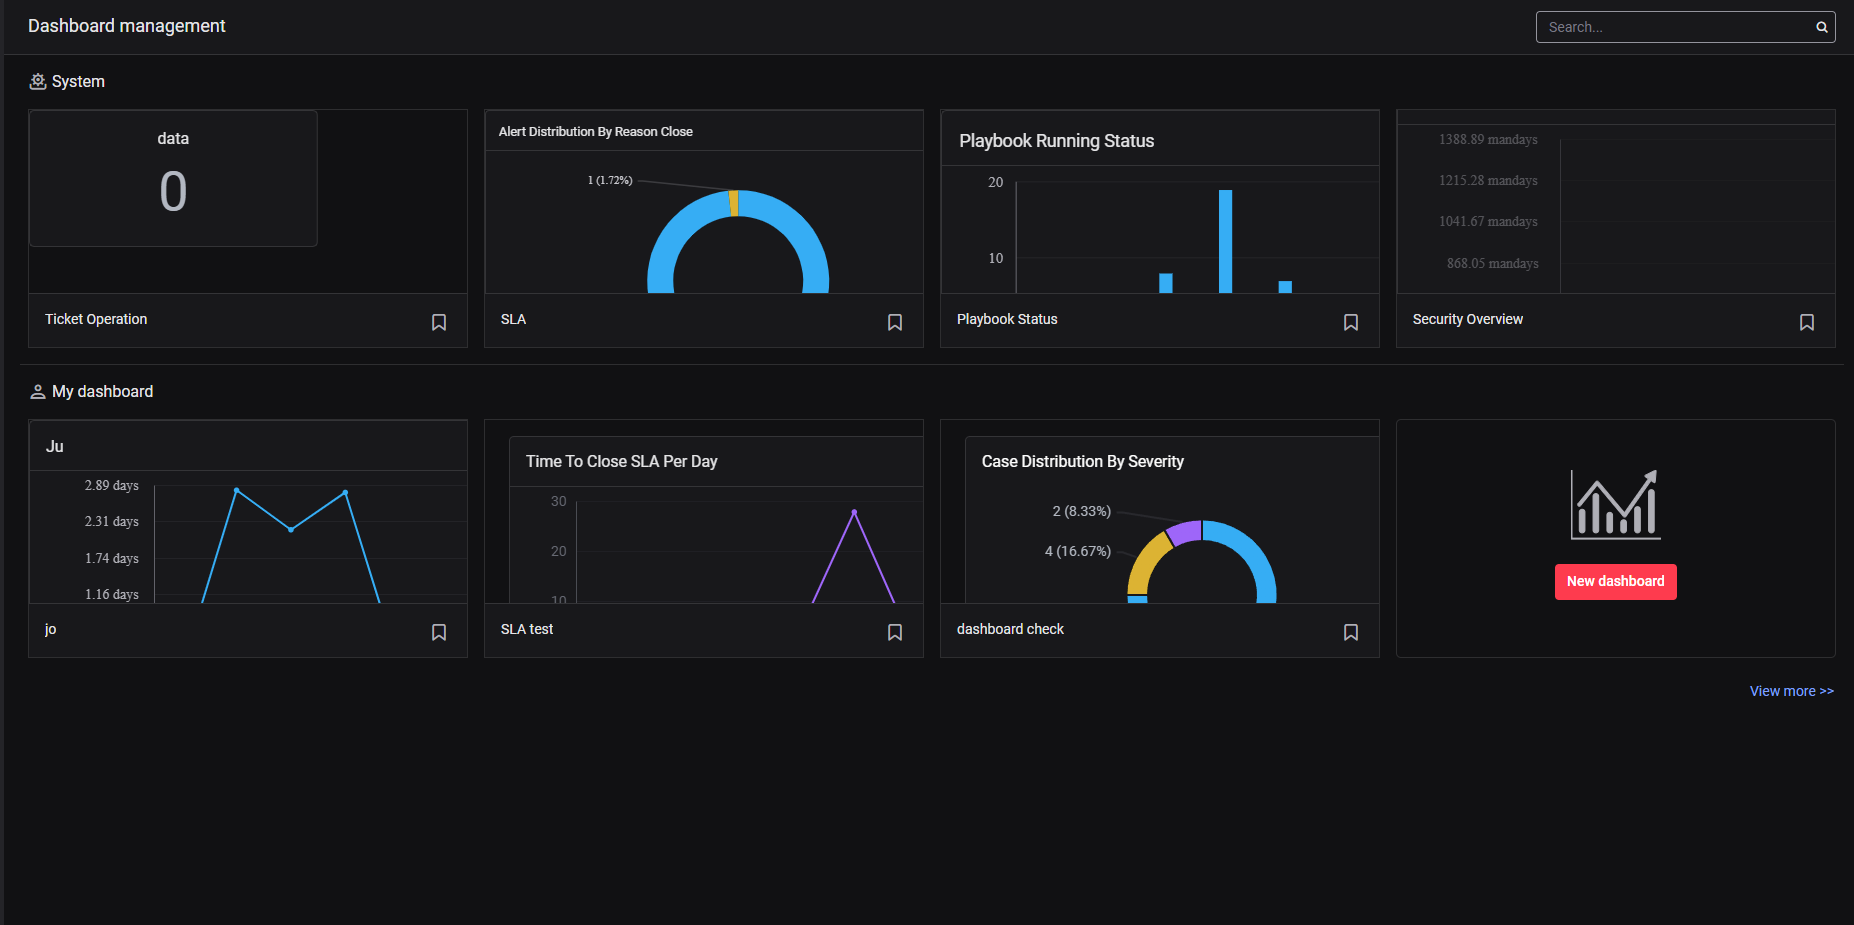
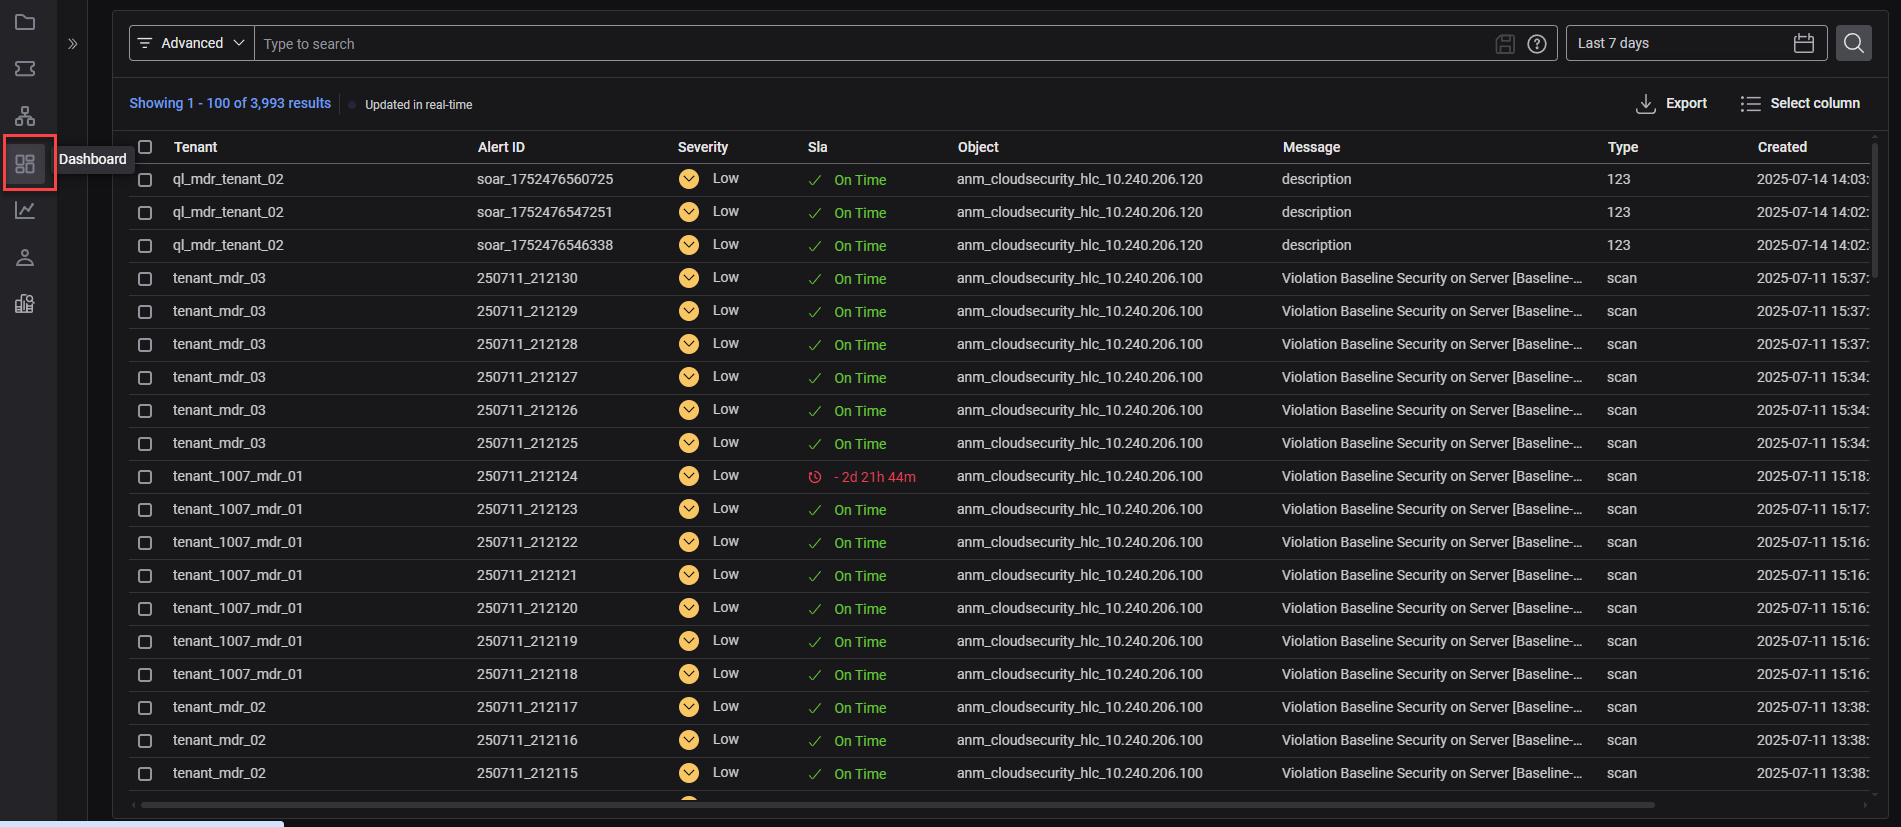
- On the menu bar, click Dashboard
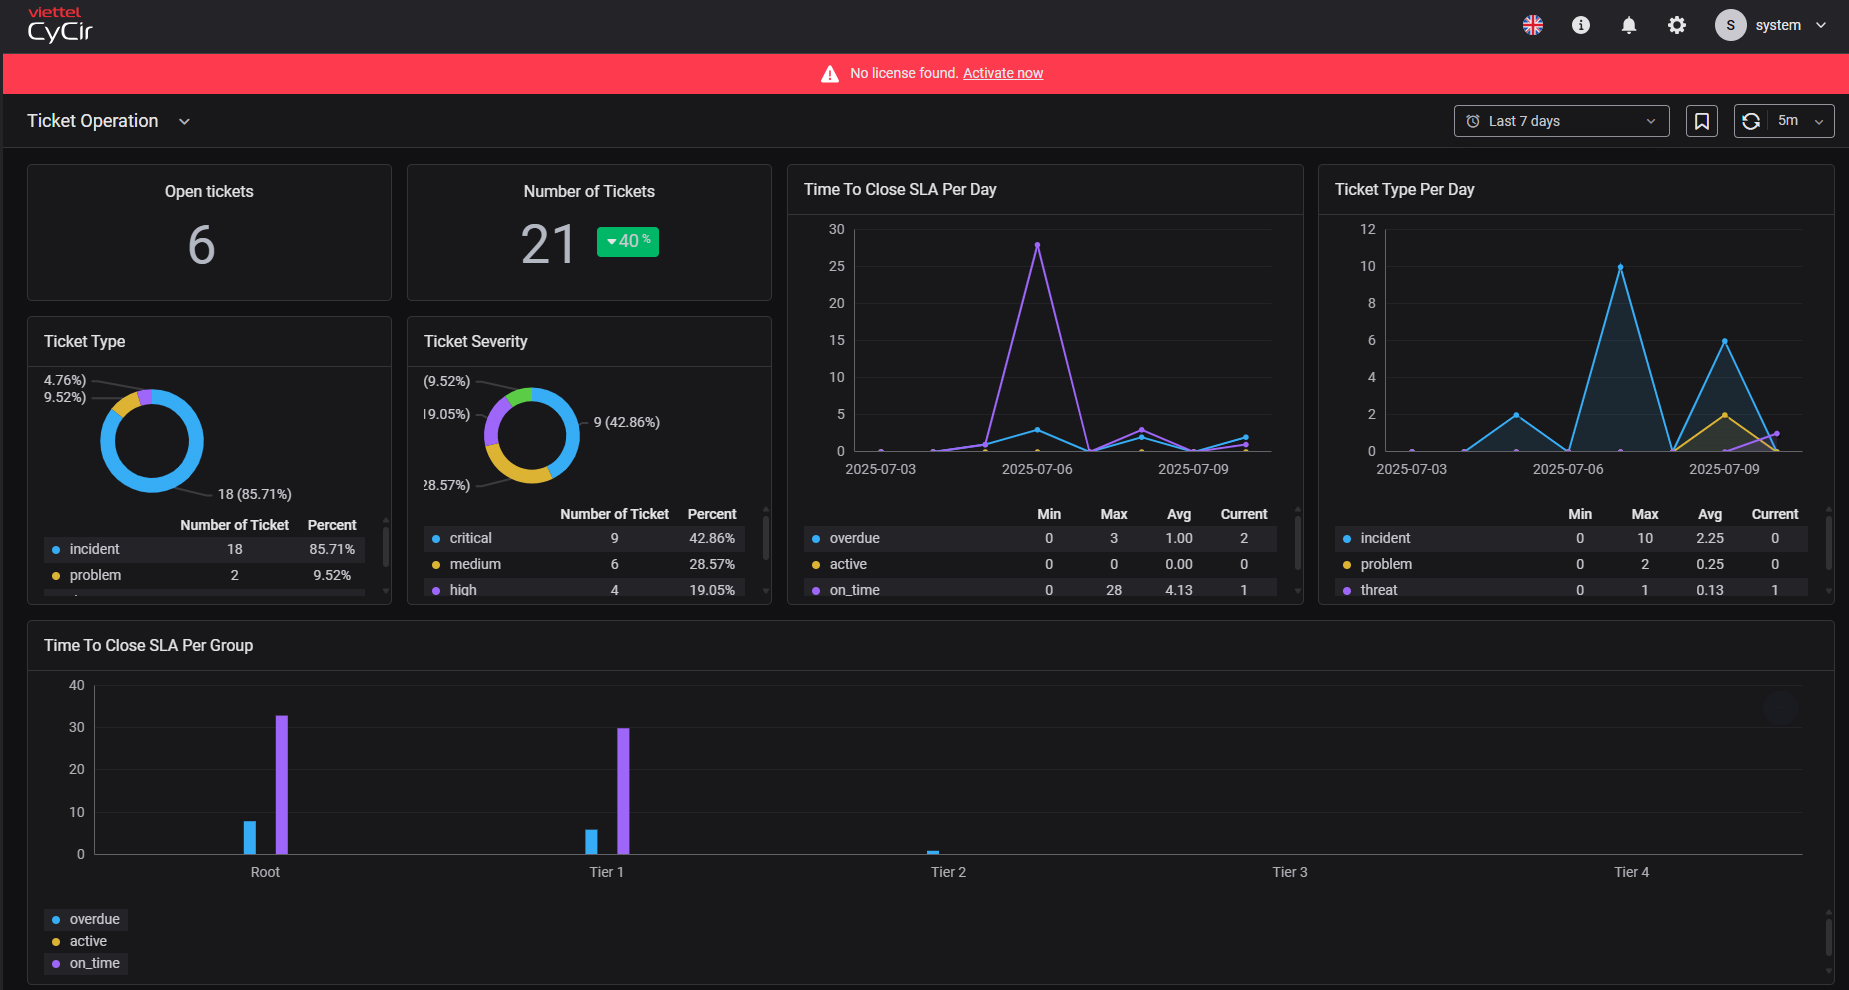
2.1. Ticket operation: Each widget on this dashboard offers a specific insight, helping you understand ticket operations
- Open Ticket: The number of open tickets, allowing the operations team and management to quickly assess the backlog of work.
- Number of Ticket: total number of tickets created within a specific period.
- Time to close SLA per day: The average time to close tickets in a single day. It helps management evaluate efficiency and improve processes. If the average time exceeds the SLA, it means the team is operating slowly or needs to re-evaluate the SLA.
- Ticket type per day: This widget helps categorize tickets created by their specific types (e.g., incident, vulnerability, problem, content) and displays the count for each type per day
- Time to close SLA per group : the average time to close tickets and the SLA compliance level for each group or department responsible for handling tickets.
2.2. SLA: Every widget on this dashboard gives me a deep dive into how well we're sticking to our SLA commitments
- MTTD (Mean Time To Detect): The average time from when a security threat or event happens until our system or team finds it. The lower our MTTD, the more quickly our system spots potential dangers.
- MTTR (Mean Time To Respond/Resolve): The average time from when an alert is detected until the related incident is fully responded to or resolved. A lower MTTR means my team is faster at fixing the aftermath of attacks.
- Saved Time: This estimates the total time your system has saved for your team. This metric is achieved by automating repetitive tasks or speeding up the process.
- Overdue Alert Handling Rate: The percentage of alerts that aren't processed within our committed SLA timeframe.
- Overdue Case Handling Rate Per Day: The percentage of cases that aren't resolved within the SLA, calculated each day.
- Overdue Case Handling Rate: The total percentage of incidents (cases) that are currently overdue compared to all our incidents.

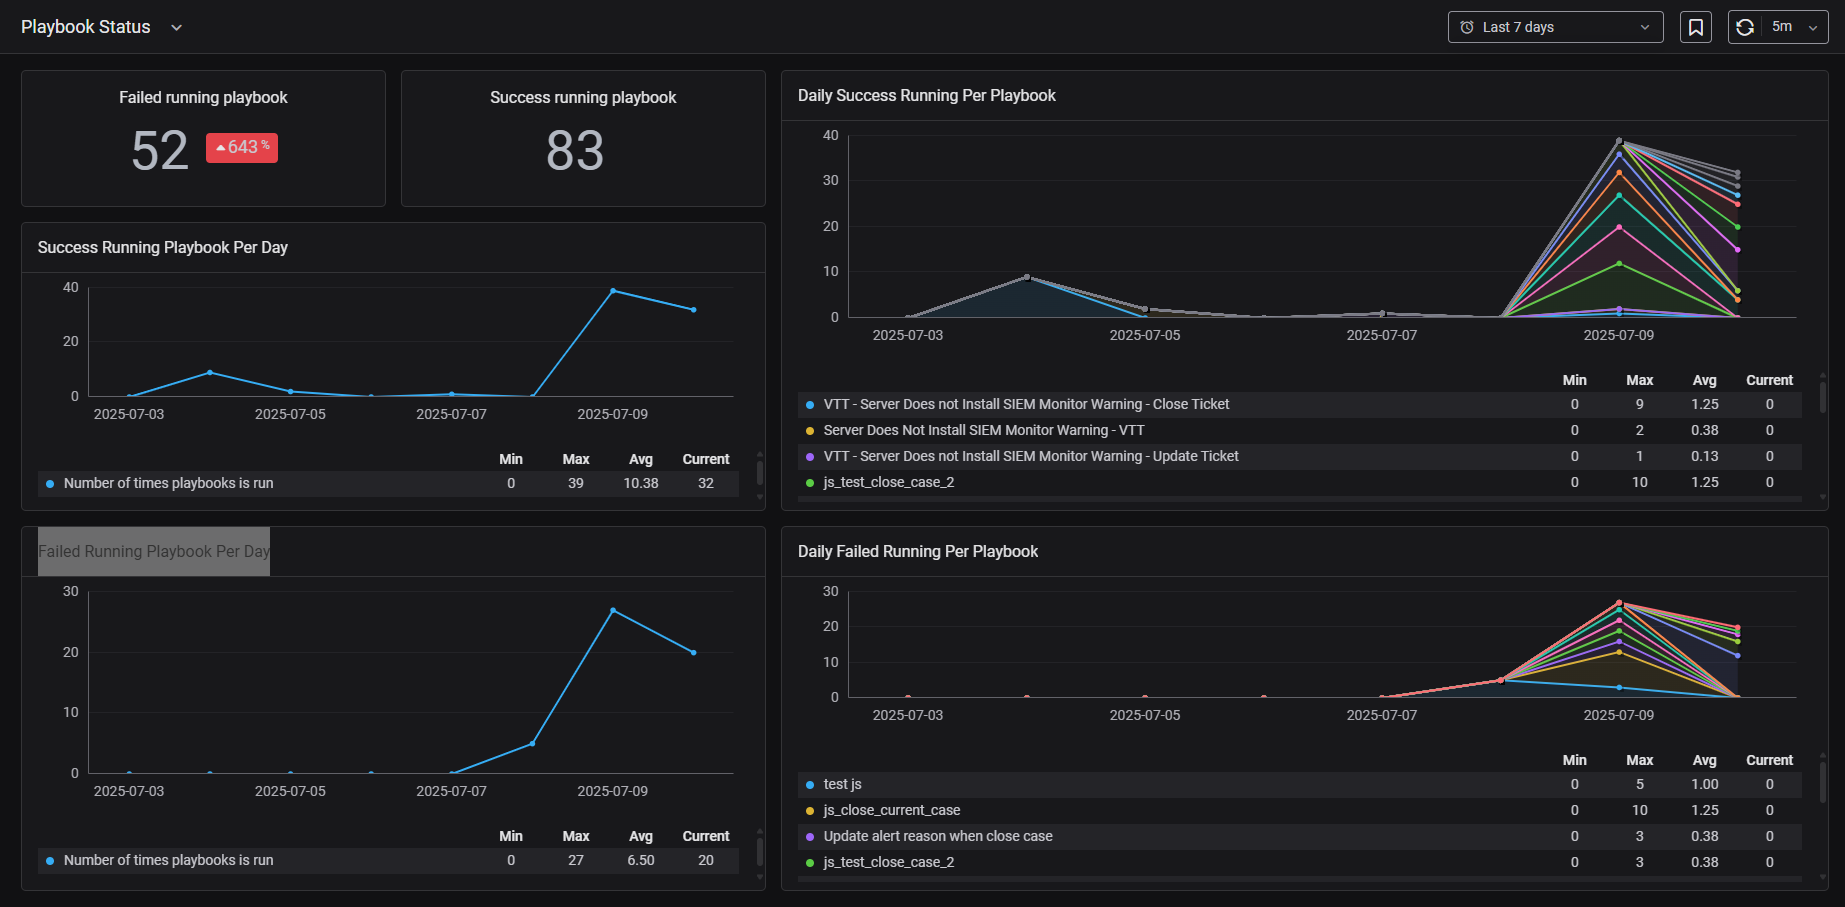
2.3. Playbook Status: This dashboard gives me a complete overview of how our playbooks are performing. It helps me quickly spot any issues and ensures our automation processes stay stable and effective.
- Failed running playbook : The total number of times playbooks were triggered but didn't complete their tasks correctly. It's a quick way to see if something's broken.
- Success running playbook : The total number of times playbooks ran and completed their missions successfully.
- Daily success running per Playbook : The number of successful runs for each individual playbook on a daily basis.
- Daily failed running per Playbook: The number of failed runs for each individual playbook per day.
- Failed running Playbook per day: The total number of playbook failures each day.
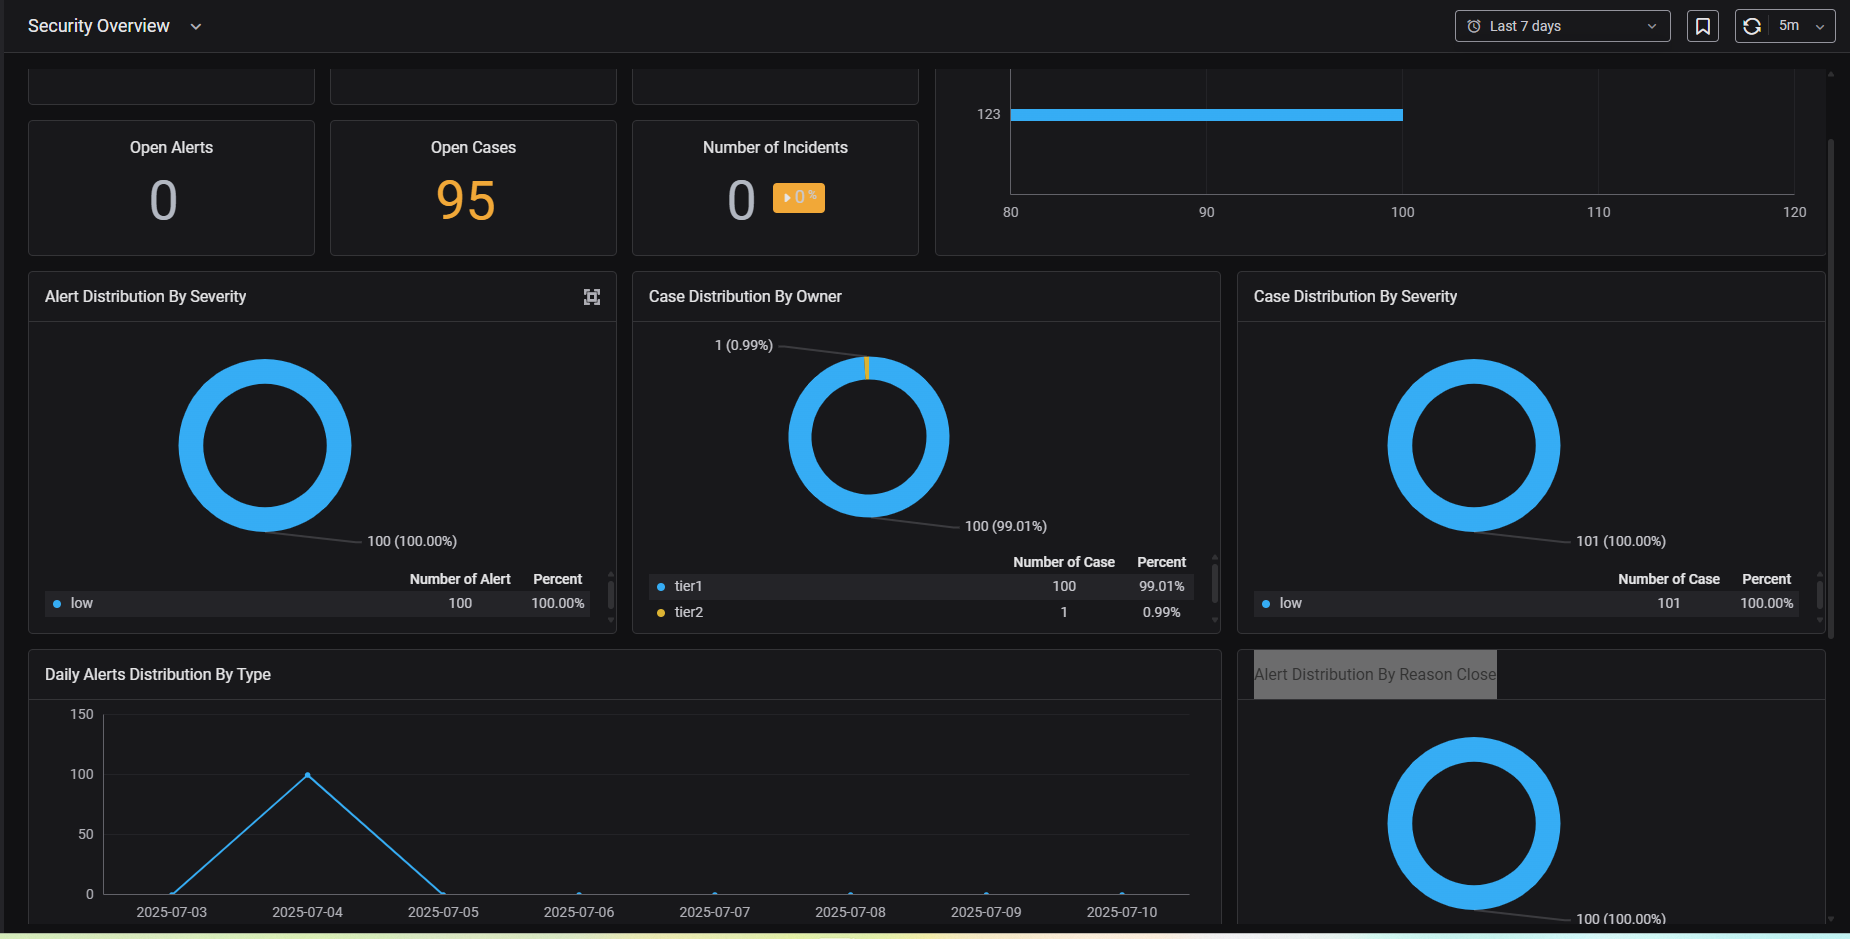
2.4. Security Overview : This dashboard provides a comprehensive overview of security posture, aiding in performance assessment and problem trend identification.
- Number of Alerts : The total number of alerts detected by the system within a specified period (e.g., daily, weekly, monthly).
- Number of Cases: The total number of security incidents (cases) created within a given timeframe.
- Number of Tickets: The total number of tickets generated within the specified period.
- Open Alerts : The number of alerts currently open and awaiting action.
- Open Cases : The number of cases currently open and awaiting action.
- Number of Incidents : The total count of critical security incidents.
- Alert distribution by type : The number or percentage of various alert types.
- Alert distribution by severity: The number or percentage of alerts classified by severity (e.g. low, medium, high)
- Case distribution by Owner : The number or percentage of incidents being managed by each individual or group within the security team.
- Case distribution by Severity : The number or percentage of incidents classified by severity.
- Daily alerts distribution by Type: Breaks down the types of alerts generated on a daily basis, helping to identify daily patterns and anomalies.
- Alert distribution by Reason close: Displays the distribution of alerts based on their closure reason, which can help identify common resolutions or recurring false positives.